01 · Bring context together
View operational information in relation to the asset or situation being assessed.
Railyze and our Data Literacy MVP show how we turn domain knowledge into digital experiences. Explore the problems they address, the workflows they investigate and their current stage.
These are examples of DIVU’s own product design and implementation work. They demonstrate approaches and interactions; customer project examples are presented separately.
An application prototype exploring how rail operations data, risk indicators and maintenance priorities can support operational decisions in one place.
Operational information can be spread across asset records, events and planning tools. Bringing the context together can help teams examine priorities and the reasons behind them.
How a specialised interface can connect operational views, risk indicators and maintenance planning. The focus is the route from data to a reviewable operational decision.
Current stage: prototype. Sign-in is required to access Railyze. Contact us for a guided demonstration.
View operational information in relation to the asset or situation being assessed.
Explore what a signal means and which underlying information needs review.
Use the combined view to support a person’s assessment of possible next steps.
An interactive MVP that helps people explore their approach to data and identify development needs. It turns a topic often handled in a workshop into an accessible digital experience.
A dashboard is only useful when people can interpret it and ask the right questions. Teams need a practical starting point for discussing how they work with data and where development could help.
How guided prompts and an individual profile can make reflection more structured and support a conversation about learning and everyday data use.
Current stage: MVP. The profile is a starting point for reflection and development, not a professional certification or proof of measured learning gains.
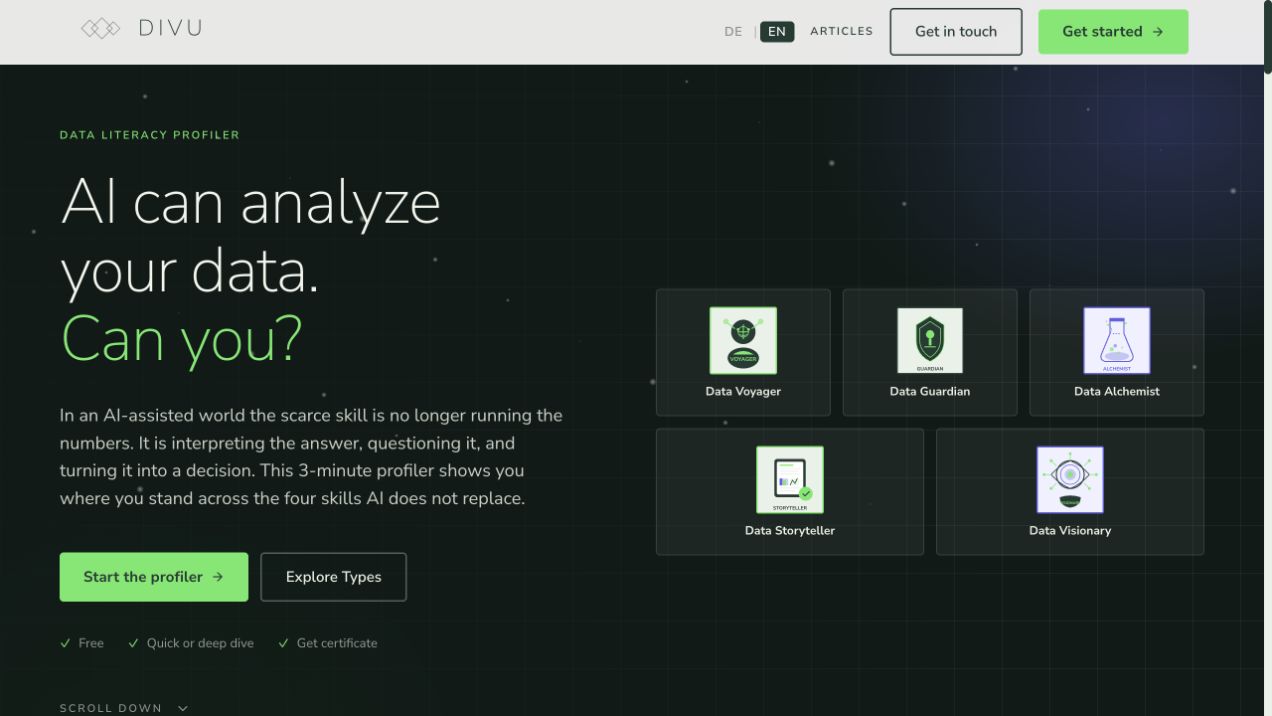
Consider how you engage with data in your work.
Use the profile as a prompt for questions about strengths and development needs.
Connect the reflection to a concrete learning goal or a real reporting task.
A working prototype helps make an idea concrete. An ongoing service also needs dependable data, agreed checks, operating responsibilities and a clear definition of what customers receive.
Understand the sources, establish definitions and make important gaps visible.
Work through a real task with intended users and agree how the result will be checked.
Specify delivery, exception handling, maintenance and the customer’s decision points.
A specialised report, a useful application or a recurring workflow: start with the task and the people who need it.